 Reporting Module
The Switch Reporting Module allows you to build custom dashboards to visualize your production.
This provides you an in-depth view of your live production.
- At each stage of the production workflow, job files can be monitored, in detail, via a fully customizable dashboard.
- At any given moment, the company can quickly locate jobs and pinpoint bottlenecks.
- Furthermore, the module also stores historical data for future reference, enabling continuous improvement and efficiency of the entire production.
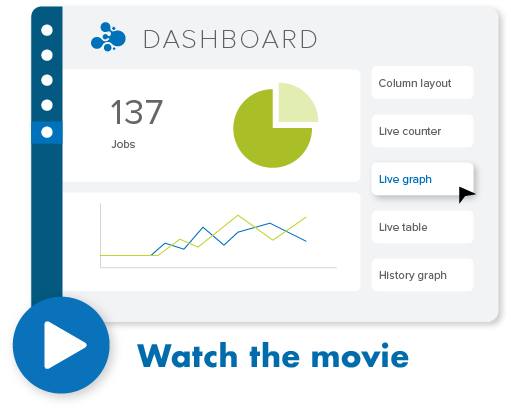
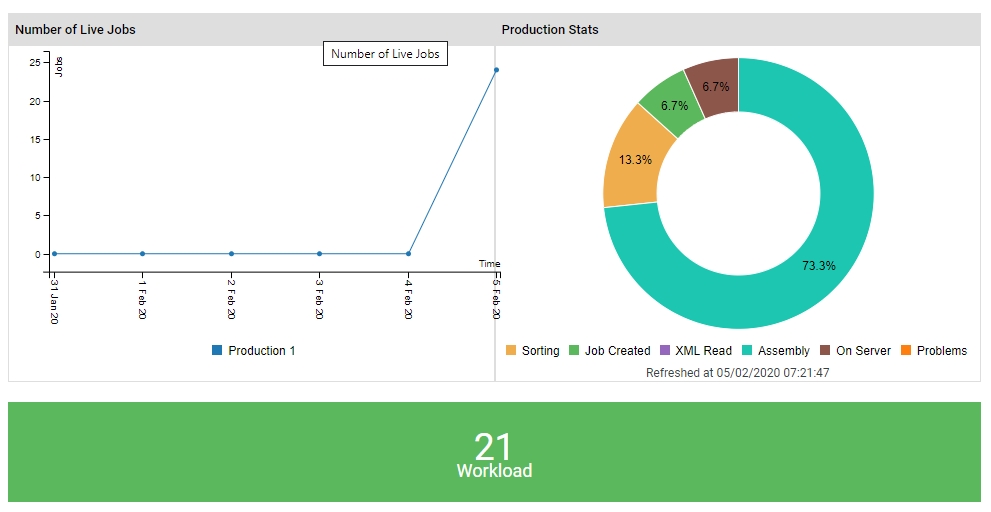
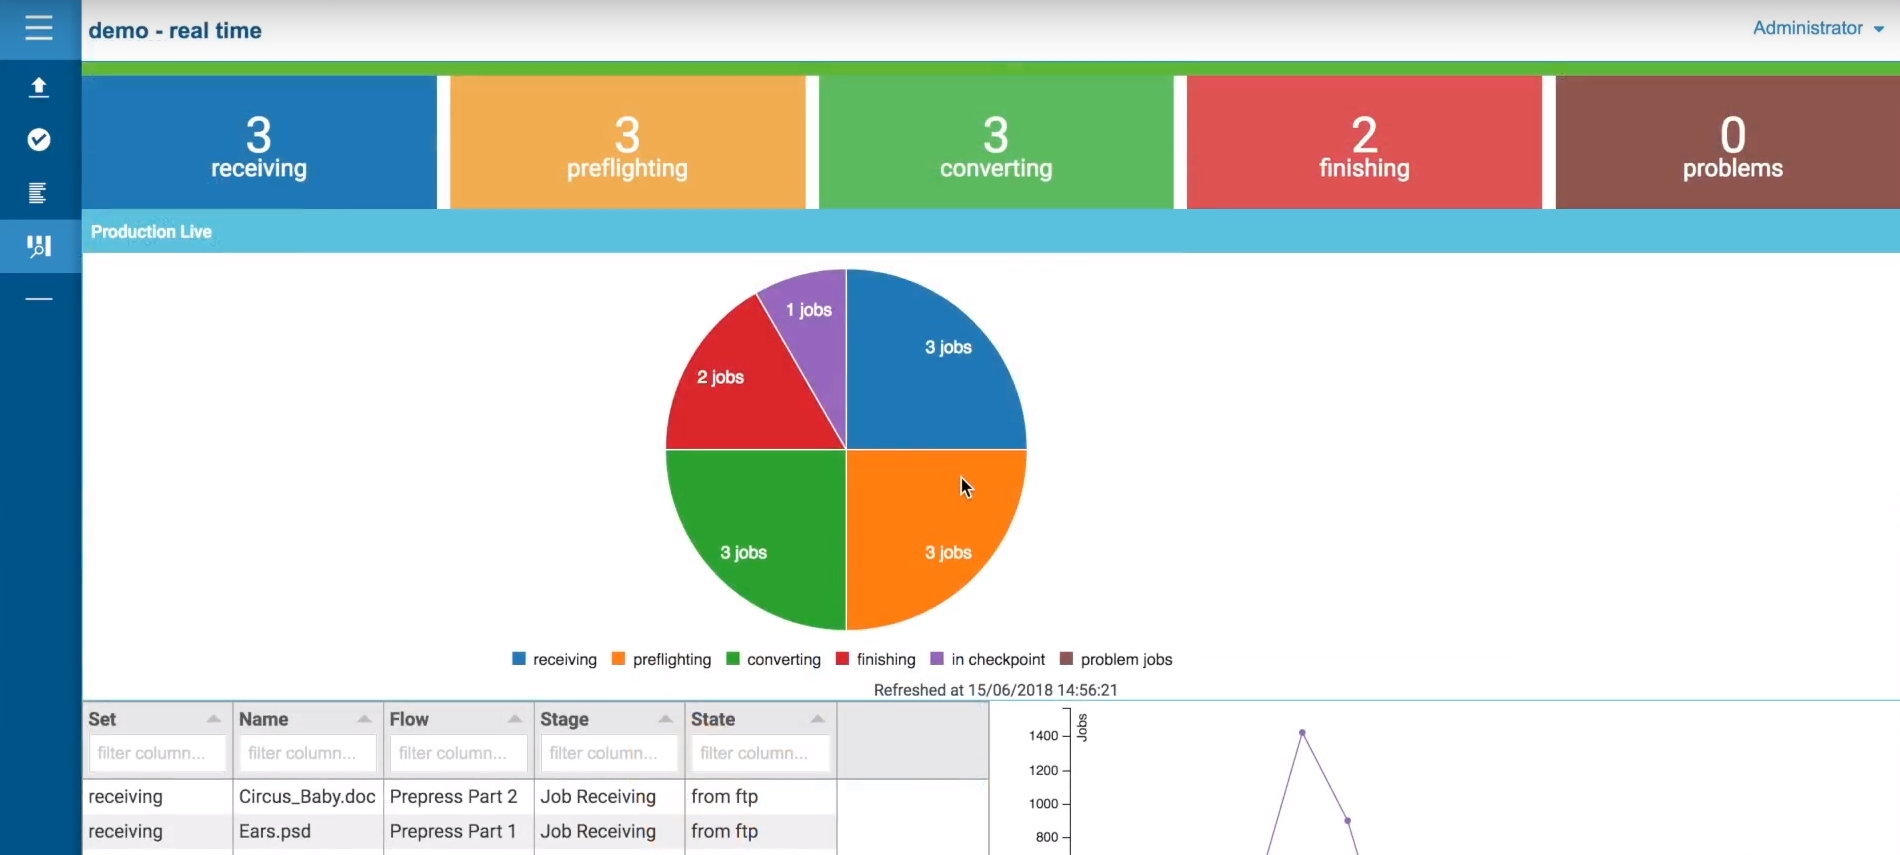
Dashboard examples